The ability to debug any modern programming language is a critical skill for programmers of all skill levels. Learning how to debug Java helps developers discover the causes of logic and non-trivial syntax errors that prevent proper execution of Java programs. The ability to step-through a Java program using a debugging environment provided by updated Integrated Development Environments (IDEs) allows code authors to understand the programmatic and logic flow of both simple and complex Java programs. There are a number of quality Java debugging tools available for no to low cost on the market such as the Eclipse and Netbeans IDEs which share common debugging concepts.
What is Software Debugging?
Java software debugging allows developers to run a Java application while observing the source code and variables during the execution of the program. Akin to monitoring the engine of a car while running, programmers can observe values assigned to objects and variables within a Java program throughout program execution to see if the application is functioning both logically and technically as expected. Most IDEs allow developers to setup breakpoints within the source code where execution will stop to help troubleshoot issues. Additionally, a watch point can setup that will only cease program execution if a predefined field is modified or read. These watch points can also be labeled as “stop points” depending on the label used by the IDE.
Debugging Tools for Java
Two of the most commonly deployed IDEs in Java development circles that support debugging in Java are the Eclipse and Netbeans IDEs. Each IDE provides support for advanced breakpoint configuration to include conditional breakpoints, exception breakpoints, and line breakpoints. For developers who do not like using an IDE, the Java debugger (JDB) is another option. JDB is command-line based, and can be used to allow developers to debug a Java program either remotely or locally.
How to Debug Java using the Eclipse IDE
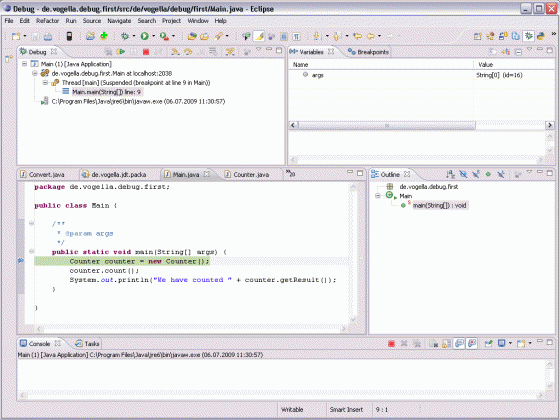
Over the past several years, the Eclipse IDE has become one of the most widely deployed for Java development. The IDE provides support for straight-forward debugging functionality which is well-defined. Additionally, Eclipse allows programmers to start-up programs in a “Debug Mode” that controls the flow of program execution.
Step 1 – Launch the Eclipse IDE.
Step 2 – Open the Java project that you desire to debug.
Step 3 – Setup breakpoints at various locations in the Java code by right-clicking in the left margin of the IDE screen.
Step 4 – Select the “Toggle Breakpoint” menu option. In the same margin of the code a circle will now be displayed on the same line. Ensure you have a minimum of one breakpoint setup in the Java code or it will run normally when attempting to debug the project.
Step 5 – Start debugging the Java file by choose the source code file that includes the “Main” method of the program.
Step 6 – Right click the file containing the main method. Then, choose the “DebugAs” and “Java Application” menu options.
Step 7 – If Eclipse asks you to change to the “debug perspective,” select the “Yes” menu button.
Step 8 – Use one of the following function key commands to “step” through the Java application in debug mode:
F5 – Go to next line of code. If the next step is a Java method, the control of the debug utility will visually shift to the first line of the method.
F6 – Does not enter a function call, it skips the function code entirely.
F7 – Exit the current code segment and proceed to the code from where this was called by the Java class.
F8 – Move or jump to the next defined breakpoint.

How to Debug Java using the Java Debugger
The Java Debugger, JDB, is included with the JDK. The application provides a basic, command-line capable debugger for all Java programs. The primary syntax for the JDB is:
jdb [options] [class] [arguments]
The options argument of JDB includes standard Java command line options such as connect, attach, help, and sourcepath. The class argument tells JDB what Java class is going to be debugged. The arguments variable is the listing of zero to many arguments that will be sent or passed to the main method of the Java program being debugged.
Step 1 – When running the Java application in debut mode in JDB, one must ensure the debug enabled option is active. For example:
java -Xdebug -Xrunjdwp:transport=dt_socket,address=8000,server=y,suspend=n [classname]
Step 2 – The JDB must be attached to a JVM. For example:
jdb -attach 8000
Step 3 – Additionally, the Java program that is going to be debugged must have been compiled using the “-g” option.
Step 4 – Use the “stop at” command to setup breakpoints at various locations in the Java program. The code can also be interpreted using the next and step commands.
Step 5 – View a full listing of JDB commands by using the jdb –help command at the command line interface of your computer.
Debug Java using NetBeans IDE
The NetBeans IDE has been used for a number of years by Java developers. Similar to the Eclipse IDE, Netbeans supports debugging of Java programs by creating breakpoints and watchpoints in the source code. Once these are configured, the application can be stepped through to interpret the code.
Step 1 – Open the NetBeans IDE by double clicking the program icon. Once the program is running, load the Java project that you desire to debug.
Step 2 – Setup a breakpoint on a line of Java code. The breakpoint will be the location in the program where the execution will suspend the and NetBeans debugger will wait for the programmer’s interaction to proceed with execution. Breakpoints are commonly inserted in locations of the program that appear to have logic or syntax issues. In order to setup the breakpoint, right click the line number on the left-hand side of the source code. Then, choose the “Breakpoint/Toggle Line Breakpoints” menu option to setup the breakpoint.
Step 3 – Select the “Ctrl” and “F5” keys to start debugging the Java project. The NetBeans debugger will run or execute the Java program to the first defined breakpoint. If you set the computer’ smouse over the variables in the program, an information window will be displayed showing the variable’s current value and type. Additionally, the current memory usage of the program will be displayed in the upper, right-hand corner of the NetBeans IDE.
Step 4 –Press the “F7” or “F8” key to proceed to the next line of the Java code in the program. The F8 key will allow the developer to “step over” the next code segment or method, while F7 will allow one to step into the method. Depending on what the issue being encountered with the Java program is, developers will commonly use each option when debugging the code.
Java Debugging Tips
When a Java programmer is new to debugging applications, there are a number of basic tips that he or she can consider employing to more effectively debug the program.
Using an Exception Breakpoint
Both the NetBeans and Eclipse IDEs allow programmers to setup exception breakpoints. This feature allows Java programmers to determine the potential cause(s) of unexpected exceptions being thrown during Java program execution. More specifically, they can help determine if there is a logic, input/output, or technical issue with the Java program execution. The Exception breakpoint can be setup via the “Breakpoint Window” in each IDE and program execution will stop during debug mode when it is thrown.
Using Conditional Breakpoints
Conditional breakpoints are setup to be used on if the predefined condition is matched when reaching that line of the program. In Eclipse, a conditional breakpoint can be configured by first double-clicking the desired line in the programming code. Then, right click the line and select the “Properties” menu option. Enter the appropriate condition and when the program is executed in debug mode execution will stop at this location if the condition is met.
Use the Logical Structure View
The logical structure view option allows programmers to view the contents located in side of the Java Collection Classes during debugging. It will display information such as the key and associated value of a hashmap for example, instead of the full details of the hashmap that may not be of use for debugging the application. The logical view can be turned on or off via the Eclipse variables window.
Using Step Into and Step Over Debugging Options
The Step Into and Step Over debugging options are common to most Java debugging applications. These options allow the programmer to step through the execution of one to many Java classes one line of code at a time if necessary. The Step Over option allows developers to skip line-by-line execution of “known good” Java methods or classes if required in order to save time while debugging a Java program.
Inspect and Watch Debugging Options
The inspect and watch debugging options can be used to observe the value of various expressions during Java debugging. To use this option, select the programming statement. Then, right click and select the “inspect” menu option. During program execution, the value of the statement will be displayed at runtime. Additionally, a watch can be placed on the statement and the value will be displayed throughout execution during debugging in its own window.
Java Step Filtering
For most Java debugging efforts, programmers do not need to step into the JDK Core Classes. In order to remain solely within the code written by the Java programmer, Java step filtering can be used. Step filtering is normally configured from the Java Debug Step Filtering menu by either enabling or disabling the feature.
Suspending and Resuming Java Threads
Many IDEs now support the ability to both suspend and resume thread execution from their debugging window. For IDEs that support this feature, the thread simply has to be selected during program debugging and the “suspend” or “resume” menu option clicked. This option proves valuable when debugging a multi-threaded application that may be running into a race condition or other problem that can prove challenging to debug.
Stop on a Pre-designated Thread
This option has to be manually configured using the debugging tools already discussed. If there is a section of code designed to run in its own thread that you desire to debug, setup a conditional breakpoint on the line. You can then use the Java Thread class to get the current thread, thread name, or other values to help further trouble shoot the application.
Using the Copy Stack Feature
If you are writing multi-threaded Java programs, it can become necessary to copy the stack of a thread to help troubleshoot issues with the code. Luckily, most IDEs will allow programmers to copy the stack of a thread by using the “Copy Stack” menu option. To turn on this feature, right click the troubled Thread in the Debug window of the IDE. Then, select the “Copy Stack” menu option.
How to debug a Google Android App using the JDebugTool?
The JDebugTool is a low cost Java dugger that is capable of also debugging Android apps.
Step 1 – Create an Android Project making use of the Eclipse Android Development Tools (ADT) plug-in.
Step 2 – Mount the application’s src directory in the JDebugTool as the source path.
Step 3 – Use the Android create avd Android command to create an Android Virtual Device (AVD).
Step 4 – Launch the Android emulator from the command prompt using the following command:
Emulator –avd avd_created_name
Step 5 – Install the Android app’s .apk file into the emulator using the following command:
adb install /path/to/the/app.apk
Step 6 – Launch the DDMS by typing the “ddms” command at the command prompt followed by pressing the “enter” key.
Step 7 – Use the android.os.Debug.waitForDebugger() method call in the Android application code to allow it to wait for the debugger to attach. It will return control to the app as soon as the debugger attaches, so a breakpoint must be setup for after the method call.
Step 8 – Open the application (or launch it) on the Android emulator.
Step 9 – Expand the tree node for the emulator in DDMS. Then, select the application located in the sub-tree of processes.
Step 10 – In the JDebugTool application, choose the “Attach” menu option located under the “Target” menu option.
Step 11 – Enter “localhost” as the “Host Name” and port “8700” followed by clicking the “Ok” menu button and proceed with debugging the application.


Follow Us!