A network management software is basically a collection of tightly integrated set of network tools that help you manage, monitor, secure and control a computer network.
Listed here are the best of the open-source network management software packages.
If these packages do not meet your requirements, look into the heavy-duty commercial grade network management systems like HP OpenView, Micromuse NetCool, and SolarWinds.
Nagios
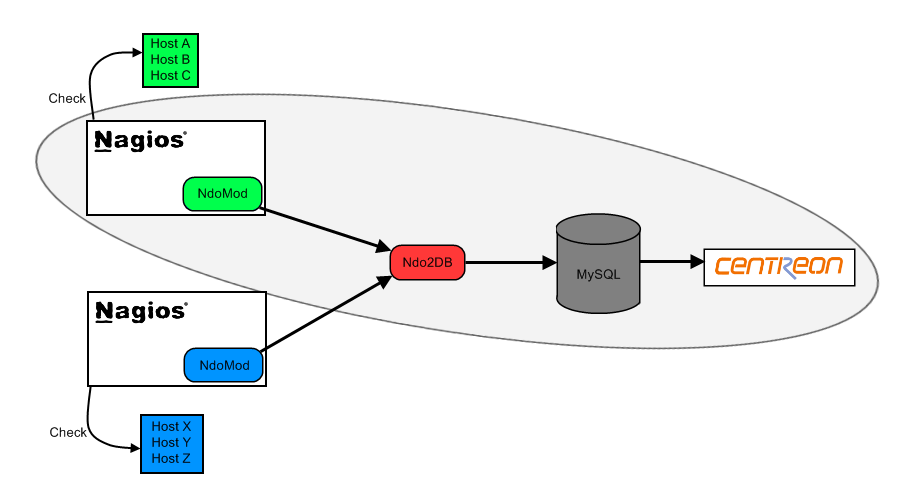
Nagios is a host and service monitor designed to inform you of network problems before your clients, end-users or managers do. It has been designed to run under the Linux operating system, but works fine under most *NIX variants as well. The monitoring daemon runs intermittent checks on hosts and services you specify using external “plugins” which return status information to Nagios. When problems are encountered, the daemon can send notifications out to administrative contacts in a variety of different ways (email, instant message, SMS, etc.). Current status information, historical logs, and reports can all be accessed via a web browser.

Features
Nagios has a lot of features, making it a very powerful monitoring tool. Some of the major features include:
- Monitoring of network services (SMTP, POP3, HTTP, NNTP, PING, etc.)
- Monitoring of host resources (processor load, disk and memory usage, running processes, log files, etc.)
- Monitoring of environmental factors such as temperature
- Simple plugin design that allows users to easily develop their own host and service checks
- Ability to define network host hierarchy, allowing detection of and distinction between hosts that are down and those that are unreachable
- Contact notifications when service or host problems occur and get resolved (via email, pager, or other user-defined method)
- Optional escalation of host and service notifications to different contact groups
- Ability to define event handlers to be run during service or host events for proactive problem resolution
- Support for implementing redundant and distributed monitoring servers
- External command interface that allows on-the-fly modifications to be made to the monitoring and notification behavior through the use of event handlers, the web interface, and third-party applications
- Retention of host and service status across program restarts
- Scheduled downtime for supressing host and service notifications during periods of planned outages
- Ability to acknowlege problems via the web interface
- Web interface for viewing current network status, notification and problem history, log file, etc.
- Simple authorization scheme that allows you restrict what users can see and do from the web interface
Centreon
Centreon is a network, system, applicative supervision and monitoring tool, it is based upon the most effective Open Source monitoring engine: Nagios. Centreon provides a new frontend and new functionnalities to Nagios.
It allows you to be more efficient in your network monitoring, but also allows you to make your supervision information readable by a largest range of users. Indeed, a non technical user can now use the Centreon/Nagios couple to easily understand your network infrastructure thanks to charts and graphical representations of the gathered information. Skilled users still have access to specific and technical information collected by Nagios though.
It has been three years since Centreon was first released, and it has already convinced most of its everyday users. Centreon has become a reference as a Nagios Frontend.
The Centreon/Nagios couple is used by a wide range of users, from novices to skilled users, even if they didn’t know Nagios before.
Here is a non-exhaustive list of the functionalities provided by Centreon:
- A highlycustomizable and intuitive multi-user interface
- An enhanced configuration tool to setup the supervised perimeter
- Configuration wizards
- A frontend to all Nagios configuration files. These configurations are linked to save your working time.
- A Nagios configuration loader module
- A Nagios 1.X and 2.x compatibility
- A Nagios configuration file-checker thanks to Nagios Debugger
- Network devices and servers ID Cards which has all the basic informations about these resources
- A customizable network cartography
- An access manager, including resources as well as interfaces restrictions
OpenNMS
While there exist many definitions of “network management”, end users consider the network to be anything on the other side of the keyboard. Thus network managers have to understand not only networking hardware like routers and switches, but things like servers, operating systems, databases and applications.
In the past, network management solutions were expensive to purchase and maintain, yet often necessary in even small environments. The OpenNMS project was started by a group of experienced network management professionals to address this by leveraging the power of open-source software to provide rapid development of powerful, stable and scalable management products.
The aim is to greatly reduce the cost of deployment and ownership while creating a highly-customizable management platform that scales to the enterprise and beyond, yet is simple enough for medium to small businesses.
OpenNMS provides three main functional areas:
- Service Polling: the system monitors services on the network and reports on their “service level”.
- Performance: data is collected from the remote systems via SNMP in order to measure the performance of the network.
- Event Management and Notifications: OpenNMS includes a robust notification system, including escalations, that can be generated by network events.
ZABBIX
ZABBIX is an all-in-one 24×7 monitoring solution without high cost.
ZABBIX is software for monitoring of your applications, network and servers. ZABBIX supports both polling and trapping techniques to collect data from monitored hosts. A flexible notification mechanism allows easy and quckly configure different types of notifications for pre-defined events.
ZABBIX offers advanced monitoring, alerting and visualisation features today which are missing in other monitoring systems, even some of the best commercial ones. Use of industry standards makes integration of ZABBIX into existing infrastructure trouble-free.
ZABBIX high-performance agents work under virtually all operating systems. Collecting of SNMP data is also supported. Thus ZABBIX takes care of monitoring and availability of any network device on your network.
NINO
NINO is a network management solution to manage routers, switches, servers and applications. Using realtime monitoring, event monitoring and reporting the health and status of your network can be monitored. On high severity events NINO can send e-mail notification.
NINO is a web based network management solution. It uses SNMP (Simple Network Management Protocol), WMI and HTTP/TCP service response to monitor hosts and network devices. NINO is running on a web server and NINO can be accessed by any computer with a web browser.
The main functions of NINO are:
- Device & Status view
- Monitoring
- Event management
- Reporting
NINO originated from the Unix world. Using Perl and Java NINO is platform independant. NINO is a package containing Perl modules on the server and Java Applets to display graphs and the NodeMap. NINO uses a webserver to take care of the user interface. The NINO servies are background processes to take care of monitoring and event handling.
The NINO services are used to receive SNMP traps and collect monitoring data. Threshold and status monitoring is used to send alerts to the trapd process if a threshold is exceeded or a device is down. All traps are stored as events in the database. All events can also be processed using eventaction. The eventaction process can send e-mail notification, send escalation alerts or execute scripts. All monitoring data is stored on the filesystem and can be used to create reports, graphs or status views.
Net-SNMP
Net-SNMP is a suite of applications used to implement SNMP v1, SNMP v2c and SNMP v3 using both IPv4 and IPv6. The suite includes:
- Command-line applications to:
- retrieve information from an SNMP-capable device, either using single requests (snmpget, snmpgetnext), or multiple requests (snmpwalk, snmptable, snmpdelta).
- manipulate configuration information on an SNMP-capable device (snmpset).
- retrieve a fixed collection of information from an SNMP-capable device (snmpdf, snmpnetstat, snmpstatus).
- convert between numerical and textual forms of MIB OIDs, and display MIB content and structure (snmptranslate).
- A graphical MIB browser (tkmib), using Tk/perl.
- A daemon application for receiving SNMP notifications (snmptrapd). Selected notifications can be logged (to syslog, the NT Event Log, or a plain text file), forwarded to another SNMP management system, or passed to an external application.
- An extensible agent for responding to SNMP queries for management information (snmpd). This includes built-in support for a wide range of MIB information modules, and can be extended using dynamically loaded modules, external scripts and commands, and both the SNMP multiplexing (SMUX) and Agent Extensibility (AgentX) protocols.
- A library for developing new SNMP applications, with both C and perl APIs.
Big Sister
The Big Sister network monitor is a real time system and network health monitoring application with featutes that include:
- Monitoring networked systems
- Providing a simple real-time view of the current network status
- Notifying you when your systems are becoming critical
- Generating a history of status changes
- Logging and displaying a variety of system performance data
MRTG

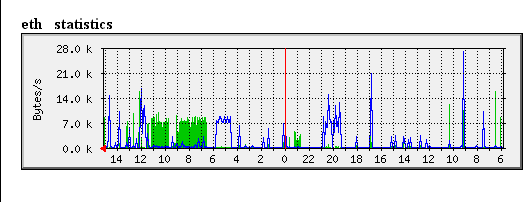
MRTG (Multi Router Traffic Grapher) is a tool to monitor the traffic load on network-links. MRTG generates HTML pages containing graphical images which provide a LIVE visual representation of this traffic.
MRTG consists of a Perl script which uses SNMP to read the traffic counters of your routers and a fast C program which logs the traffic data and creates beautiful graphs representing the traffic on the monitored network connection. These graphs are embedded into webpages which can be viewed from any modern Web-browser.
In addition to a detailed daily view, MRTG also creates visual representations of the traffic seen during the last seven days, the last five weeks and the last twelve months. This is possible because MRTG keeps a log of all the data it has pulled from the router. This log is automatically consolidated so that it does not grow over time, but still contains all the relevant data for all the traffic seen over the last two years. This is all performed in an efficient manner. Therefore you can monitor 200 or more network links from any halfway decent Unix box.
MRTG is not limited to monitoring traffic, though. It is possible to monitor any SNMP variable you choose. You can even use an external program to gather the data which should be monitored via MRTG. People are using MRTG, to monitor things such as System Load, Login Sessions, Modem availability and more. MRTG even alows you to accumulate two or more data sources into a single graph.
Real-time NetFlow Analyzer
Real-time NetFlow Analyzer unlocks the power of NetFlow on your network. This new free tool determines the types of traffic on your network, where it’s coming from, and where it’s going. Real-time NetFlow Analyzer takes the guesswork out of diagnosing traffic spikes and stores up to one hour of NetFlow data – giving you X-ray vision into what’s on your network.
For more information on network monitoring and management software, visit NetworkMonitoring.org and NetworkManagementSoftware.com.


Follow Us!